-
求均值,表格中含有空值:
#The result of this is that mean_age would be nan. This is because any calculations we do with a null value also result in a null value
mean_age = sum(titanic_survival["Age"]) / len(titanic_survival["Age"])
print (mean_age)
运行结果:

-
正确的均值
age = titanic_survival["Age"]
# print(age.loc[0:10])
age_is_null = pd.isnull(age)
#we have to filter out the missing values before we calculate the mean.
good_ages = titanic_survival["Age"][age_is_null == False]
#print good_ages
correct_mean_age = sum(good_ages) / len(good_ages)
print (correct_mean_age)
运行结果:

-
mean()
# missing data is so common that many pandas methods automatically filter for it
correct_mean_age = titanic_survival["Age"].mean()
print (correct_mean_age)
运行结果:

-
计算不同类别的均值
#mean fare for each class
passenger_classes = [1, 2, 3]
fares_by_class = {}
for this_class in passenger_classes:
    pclass_rows = titanic_survival[titanic_survival["Pclass"] == this_class]
    pclass_fares = pclass_rows["Fare"]
    fare_for_class = pclass_fares.mean()
    fares_by_class[this_class] = fare_for_class
print fares_by_class
运行结果:

-
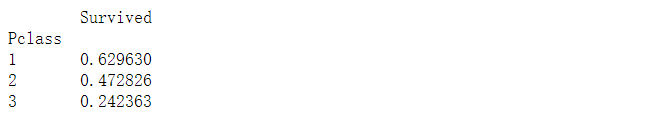
数据透视表 获救的比例
#index tells the method which column to group by
#values is the column that we want to apply the calculation to
#aggfunc specifies the calculation we want to perform
passenger_survival = titanic_survival.pivot_table(index="Pclass", values="Survived", aggfunc=np.mean)
print (passenger_survival)
运行结果:
-
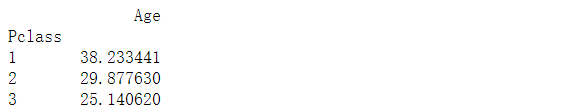
平均年龄
passenger_age = titanic_survival.pivot_table(index="Pclass", values="Age")
print(passenger_age)
运行结果:
-
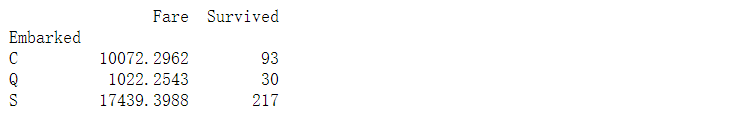
一个量和两个量之间的关系
port_stats = titanic_survival.pivot_table(index="Embarked", values=["Fare","Survived"], aggfunc=np.sum)
print(port_stats)
运行结果:
-
dropna
#specifying axis=1 or axis='columns' will drop any columns that have null values drop_na_columns = titanic_survival.dropna(axis=1) new_titanic_survival = titanic_survival.dropna(axis=0,subset=["Age", "Sex"]) #print new_titanic_survival -
loc函数
row_index_83_age = titanic_survival.loc[83,"Age"]
row_index_766_pclass = titanic_survival.loc[766,"Pclass"]
print (row_index_83_age)
print (row_index_766_pclass)
运行结果:

考研
BeanMap
python教学
驱动开发
安卓分区
kotlin
课程设计
node
ioc
指针
Java开发
大端
web大学生网页作业成品
Pyhton
volatile
neo4j
AI二次开发
Impala
condition
寄生-捕食算法
pandas常用预处理方法
news/2024/7/7 9:55:21
相关文章

VS 2010之多显示器支持 / Multi-Monitor Support (VS 2010 and .NET 4 Series)
【原文地址】Multi-Monitor Support (VS 2010 and .NET 4 Series) 【原文发表日期】 Monday, August 31, 2009 10:37 PM
这是我针对即将发布的VS 2010 和 .NET 4所撰写的 贴子系列的第四篇。
今天的贴子讨论其中一个IDE改进,我知道很多人都在迫切期望VS 2010的--…
pandas自定义函数
sort_values和reset_index new_titanic_survival titanic_survival.sort_values("Age",ascendingFalse)
print (new_titanic_survival[0:10])
titanic_reindexed new_titanic_survival.reset_index(dropTrue)
print(titanic_reindexed.iloc[0:10])运行结果…


技术人员不应该固步自封
能力的提高不是通过量,而是通过质来提高的。
经常听到人们说,这点东西犯不到花这么大力气。
如果是学术问题,我觉得OK,确实是这样,因为有思路就行了。
但是技术问题则不同,光有想法是不够的。工程上是要…

字符串相似度算法 / The Arithmetic of String Similarity Degree
dongle2001的《字符串相似度算法介绍(整理)》中提到,算法分为三类:
1、编辑距离(Levenshtein Distance)
编辑距离就是用来计算从原串(s)转换到目标串(t)所需要的最少的插入,删除和替换 的数目…
最新文章
- uniapp零基础入门Vue3组合式API语法版本开发咸虾米壁纸项目实战
- 数字图像处理、机器视觉(计算机视觉)、计算图形学概念
- 推荐3款【王炸级别】的效率软件,免费无广告,你一定要收藏
- 【AI资讯】可以媲美GPT-SoVITS的低显存开源文本转语音模型Fish Speech
- 《C语言》预处理
- 2000-2019年各省市资源错配指数
- NetBeans下设计UML模式
- Tangram商业版本预览(七):MFC/COM/.NET对象的集成、组合平台
- 用CFindFile遍历目录
- .NET和JAVA的跨平台,我们很期望,其实不容易
- [ ES6 ] 三. 使用 ES6 来写gulp任务
- [ 逻辑锻炼] 用 JavaScript 做一个小游戏 ——2048 (初级版)